4.4.1 Potential Biogas Generation, Utilisation and treatment
This chapter aims to determine the quantity of biogas that can be produced in the given situation, demonstrate how the biogas can be utilised, and offer an example of necessary treatment.
Potential Biogas Generation
To begin with, it is important to determine the potential amount of biogas that can be produced. This can be achieved by referring to the provided table containing all the necessary information.
It is important to note that the design parameters outlined in this training material are solely meant to serve as an illustration for training purposes. Applying these parameters to actual application systems without adequate verification is not recommended.
| Parameter | Value | Unit | How data was obtained |
|---|---|---|---|
| Number of people | 600 | Users/day | Given |
| Inflow quantity per person | 6.2 | L/user/day | Water usage survey: 5L/cap/day for cleansing and flushing. Estimated excreta generation rate 1.2L/cap/day (Urine 0.9L/cap/day, Faeces: 0.3L/cap/day) |
| TS | 13,000 | mg/L | Characterisation study |
| VS | 9,200 | mg/L | Characterisation study |
| Specific biogas production (Median) | 0.23 | m3/kgVS | Characterisation study (BMP test) |
First, we must determine the amount of organic material supplied into the digester daily, and to do so, we need to calculate the total inflow per day, measured in cubic meters.

Where,
| Parameter | Description | Unit |
|---|---|---|
| IN TOTAL | Total inflow per day | m³/day |
| P | Number of people | users/day |
| INP | Inflow quantity per person | m³/day |

Further, we need to understand how much organic materials measured as volatile solids (VS) will be added for conversion into biogas.

Where,
| Parameter | Description | Unit |
|---|---|---|
| OLR | Organic loading rate | kgVS/day |
| IN TOTAL | Total inflow per day | m³/day |
| QVS | Quantity of VS | mg/L |

Finally, we can determine the anticipated amount of biogas. Based on the BMP test, the specific biogas production rate is 0.23 m3/kgVS.

Where,
| Parameter | Description | Unit |
|---|---|---|
| QGAS | Biogas production rate | m³/day |
| OLR | Organic loading rate | kgVS/day |
| BMP | Biogas potential | m³/kgVS |

Potential Biogas Utilization
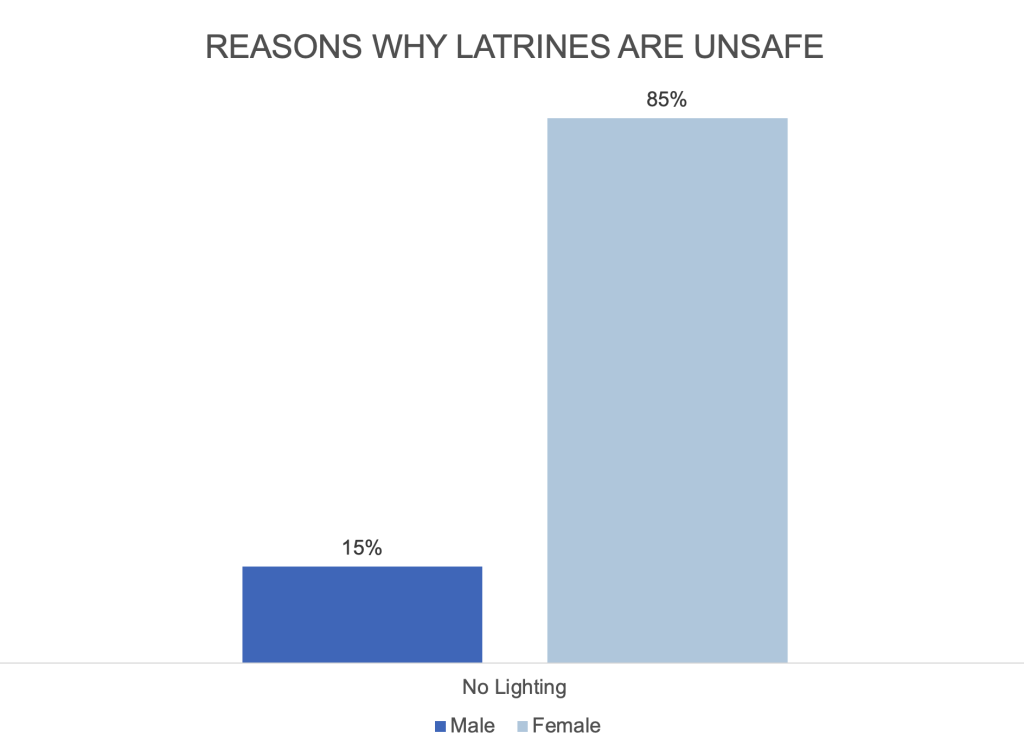
The survey results indicated that the absence of proper lighting contributed to the perception that the restroom was not secure. The data is presented in the following graph.

Based on the observation, it was decided to use the biogas as a lighting source for 8 hours at night.
| Parameter | Value | Unit | How data was obtained |
|---|---|---|---|
| Biogas consumption | 100 | L/h | Manufacturer |
| Operation of biogas lamp | 8 | h |
First, we need to calculate how many lamps can be operated with the expected biogas production rate of 7.87m3/day and the biogas consumption of 100L/h/Lamp for 8 hours of light at night.

The biogas production rate is sufficient to supply fuel for nine biogas lamps. The decision was made to allocate two lamps for each female restroom block and one lamp for each male restroom block.
Treatment
As discussed in the basics of anaerobic digestion, biogas consists of more than just methane or carbon dioxide. It also contains water and hydrogen sulphide, which need to be eliminated. The following table presents the H2S concentration and the biogas lamp tolerance.
Hydrogen Sulphide

The following table presents the possible H2S concentration in biogas produced from excreta and the biogas lamp tolerance.
| Parameter | Value | Unit | How data was obtained |
|---|---|---|---|
| H2S tolerance of a biogas lamp | 200 | ppm | Manufacturer |
| H2S Concentration | 4000 | ppm | Measured from similar biogas plants in the area |
The level of H2S in the biogas measures 4000 ppm, which is higher than the acceptable limit. To tackle this issue, a desulphurisation unit must be installed before the biogas lamps. The manufacturer has shared details about the desulphurisation unit, as summarised in the table below.
| Parameter | Value | Unit | How data was obtained |
|---|---|---|---|
| H2S removal efficiency | 99 | % | Manufacturer |
| Flow rate | <10 | m3/d | Manufacturer |
| Total treatment capacity | 400 | m3 | Manufacturer |
| Volume | 2 | Litres | Manufacturer |
To proceed, we need to verify the intended concentration of H2S once the desulphurisation process is complete and determine the number of units required to reach the permissible H2S levels.

Where,
| Parameter | Description | Unit |
|---|---|---|
| COUT | Concentration OUTPUT | ppm |
| CIN | Concentration INPUT | ppm |
| ER | Removal Efficiency | % |

Based on the result, the concentration level after the desulphurisation unit – at 40 ppm – falls below the acceptable threshold. As a result, a single unit should suffice.
Additionally, we must confirm whether the flow rate of the desulphurisation unit aligns with the anticipated biogas flow rate.
The anticipated biogas production rate of 7.8m3/d falls below the specified maximum flow rate of 10m3/d for the desulphurisation unit, making it compatible.
For planning, we also need to know how frequently the filter needs to be exchanged, which is defined by the total treatment capacity.
To determine how often to change the filter media, divide the treatment capacity by the biogas production rate.

In our situation, replacing the filter media after 51 days is suggested.
